Coffee Brewing Control Chart [Latest Version] – Free Download – The quality of a cup of coffee is determined not only by what it dissolves (the extraction rate) but also by the content of those solutes.
In other words, the “strength” of the coffee is equally important. When we talk about strength or strength.
This does not mean the caffeine content of the cup. In coffee, power refers to the number of compounds dissolved in the drink (i.e. the mass of solids that pass from the coffee into the water).
However, you need to understand that strength is closely related to the extraction ratio (the ratio of solutes to the volume of coffee carried out).
If you are using less water to increase the strength of the coffee, it will be difficult for the water to extract all the desired flavours.
Therefore, you should find an optimal brew ratio to create the full strength of the coffee you enjoy before improving your extraction.
The relationship between the three factors: (1) strength, (2) extraction rate, and (3) phase ratio, has been a vital research premise since the 1950s and has become the foundation for modern Extraction Science.
![Coffee Brewing Control Chart [Latest Version] - Helena Coffee Vietnam](https://live.staticflickr.com/65535/52181302730_381ed9dff3_o.jpg "Coffee Brewing Control Chart [Latest Version] - Helena Coffee Vietnam")
The article focuses quite a bit on the relationship between solute strength/concentration (TDS), extraction ratio (EY), and brew ratios. If these concepts are not clear, you should take a look. the following articles:
A work by Ernest Earl Lockhart
Many science programs focus on alcohol, beer, cocoa, or almonds, but coffee-intensive research programs are stubs.
So the SCA once mentioned in one of their posts that: Compared with many other essential food products, brewed coffee has unfortunately received little attention academically.
Thus, it can be said that the history of academic research on coffee in general, and filter coffee in particular, is still relatively sparse.
![Coffee Brewing Control Chart [Latest Version] - Helena Coffee Vietnam](https://alchetron.com/cdn/ernest-earl-lockhart-1f5ec8b9-e4d0-41b5-b8e6-1c1ca5358dd-resize-750.png "Coffee Brewing Control Chart [Latest Version] - Helena Coffee Vietnam")
However, there was one exception regarding Ernest Earl Lockhart’s work.
A biochemist who received his doctorate at the Massachusetts Institute of Technology (MIT) in 1939, Lockhart had a fascinating career: before he discovered latte, he helped explore Antarctica (with sledge dogs).
In 1940 (where he probably developed a passion for hot coffee!) He later studied and taught food science at MIT, but for coffee enthusiasts, he contributed.
His most important role is as director of Coffee Brewing Institute – one of the first research members working in the field of coffee science.
Lockhart made a significant contribution to coffee science with an article in 1957. This was the first time the coffee industry sought to answer how much-dissolved substance was in the coffee cup.
The results are presented in the famous work: “The Soluble Solids In Coffee As An Index To Cup Quality“.
In this study, he proposed a radical idea for his time: You could describe how good your coffee was by measuring the number of coffee grounds dissolved into the liquid.
In modern terminology, we call this measurement the “total dissolved solids” or TDS (Total Dissolved Solids) of the coffee.
Lockhart also points out that TDS is related to “extraction yield” or percentage of extract called EY (Extraction Yield), which means the ratio between the amount of instant and liquid coffee in the cup versus the original amount of coffee.
TDS and EY are linked together by the “blend ratio”, i.e. the amount of water you use per volume of coffee grounds.
Coffee Brewing Control Chart
Research on this issue dates back to the 1950s and was conducted throughout the 1970s by an institution called the Coffee Brewing Institute, which laid down most of the foundational concepts of coffee extraction.
Which we still use today. Dr EE Lockhart was the institute’s first director.
He was noted for his leadership in carrying out some of the most advanced coffee research at the time, including measuring the “dissolved solids” in coffee as an indicator—of the brewed coffee quality.
In the 1950s, there were many opinions in the coffee industry about what constitutes a “good cup of coffee,” but there was little research to shed light on those opinions.
As a result, the National Coffee Association of America awarded a PhD in food technology from the Massachusetts Institute of Technology (MIT) to Dr Ernest Earl Lockhart to conduct a series of studies to determine how to define the “quality of coffee” we still use today.
Dr EE Lockhart was the institute’s first director. He was noted for his leadership in conducting some of the most advanced coffee research at the time, including measuring “soluble solids” in coffee as an indicator of coffee quality. Quantity.
![Coffee Brewing Control Chart [Latest Version] - Helena Coffee Vietnam](https://cdn.theatlantic.com/assets/media/img/posts/Brewing%20Control%20Chart%20570.jpg "Coffee Brewing Control Chart [Latest Version] - Helena Coffee Vietnam")
![Coffee Brewing Control Chart [Latest Version] - Helena Coffee Vietnam](https://cdn.theatlantic.com/assets/media/img/posts/Golden%20Ratio_570.jpg "Coffee Brewing Control Chart [Latest Version] - Helena Coffee Vietnam")
Despite a great deal of research work, one of the most valuable assets Dr Lockhart has to offer to the coffee industry is the Coffee Brewing Control Chart.
The relationship of strength, extraction, and brewing ratio provides an approach that can quantify the “quality” factor in coffee extraction.
The brewing control chart has been shown. It provides a simple tool to record the consistency of the extraction process. This work laid the groundwork for good coffee making and has since allowed us to discuss the issue among an educated coffee community.
EE Lockhart . stub chart
The Coffee Brewing Control Chart below was first introduced in 1957. In more than 60 years, very few studies have emerged confirming these findings.
Furthermore, the way coffee is roasted and brewed has evolved in recent years, and consumer preferences may also change over time. For this reason, researchers recently adopted a newer chart version (below).
![Coffee Brewing Control Chart [Latest Version] - Helena Coffee Vietnam](https://live.staticflickr.com/65535/52180814106_01717c4bf9_o.jpg "Coffee Brewing Control Chart [Latest Version] - Helena Coffee Vietnam")
Today, almost no one measures brewing rates in the fashion: “one ounce of coffee to half a gallon .” water “; So the units on this chart have been improved (illustrated below).
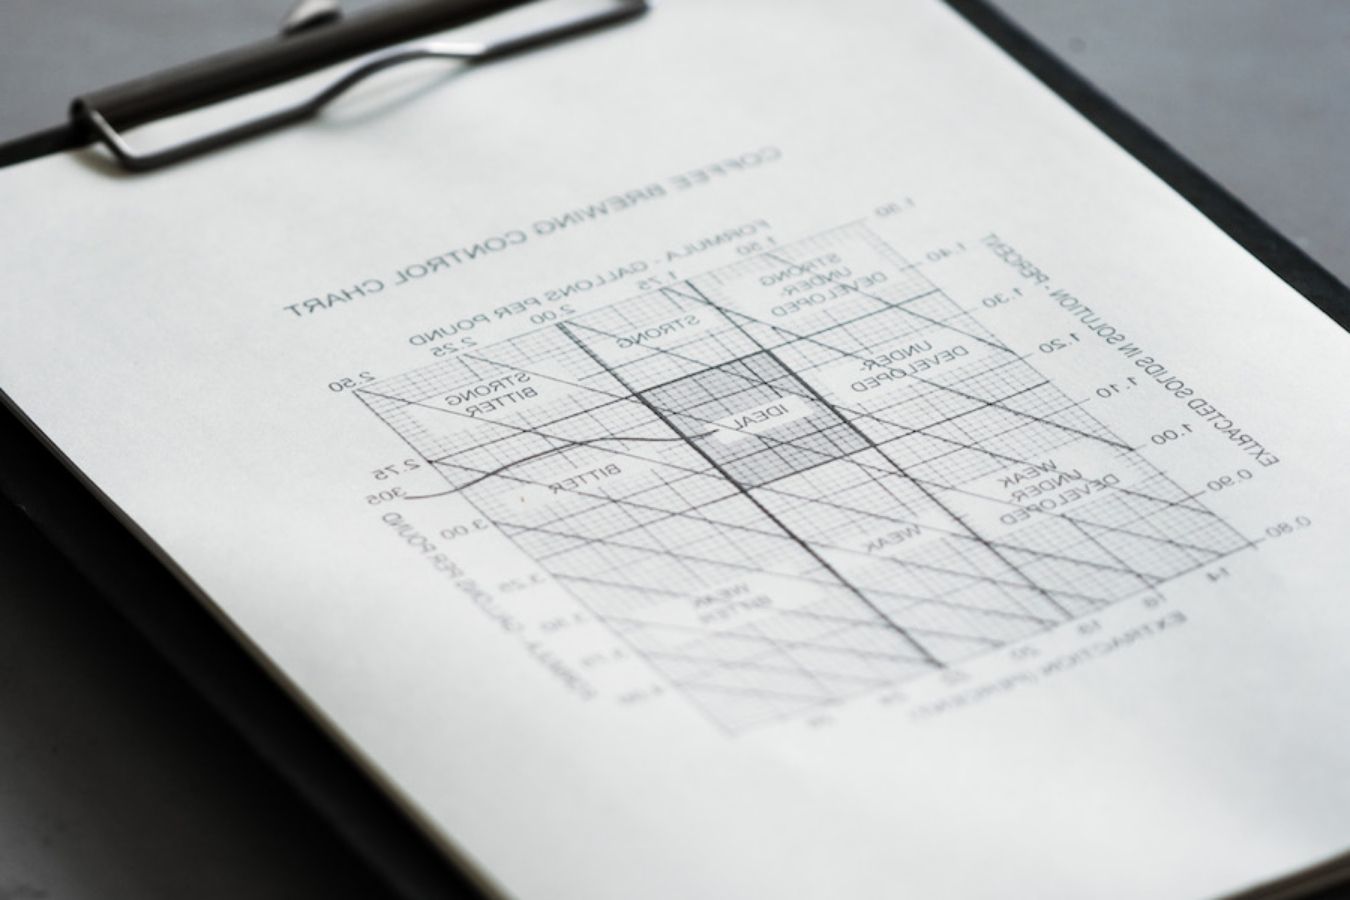
Looking at this diagram, you will see that the vertical axis on the left of the graph represents the strength scale of the coffee based on a percentage of Total Dissolved Solids (TDS) starting from 0.80% on the right.
Bottom and raised to 1.50% at the top. The horizontal axis below the graph will show you the solute extraction ratio (Extraction Yield (EY)), starting with 14% on the left side and expanding to 26% on the right side.
The diagonal lines on the chart from left to right represent the dispensing ratio. Specific coffee/water ratios are shown at the top of the chart and down the right-hand side.
The most robust balance: 1.50 gallons of water (about 5.67 litres) appears in the upper left corner, and the weakest ratio of 4.00 gallons (approximately 15.15 litres) appears in the lower right corner of the graph.
Based on CBCC, you will see the relationship between concentration and extraction rate.
Suppose we know the values of two of the three factors of concentration (TDS), extraction ratio ( Extraction Yield ) and brewing ratio ( Brewing ratio ). In that case, we can calculate the value of the third factor. We will show how this is calculated in a later post!
![Coffee Brewing Control Chart [Latest Version] - Helena Coffee Vietnam](https://live.staticflickr.com/65535/52187328582_c30227dbc4_h.jpg "Coffee Brewing Control Chart [Latest Version] - Helena Coffee Vietnam")
A small problem that can become a big obstacle is that the device allows you to accurately read Total Dissolved Solids (TDS) in your coffee and then compare your coffees with the Coffee Brewing Control Chart.
Refractometer – you can find one at BaristaHustle. This way, you can refine your results based on science and taste.
However, some purists are against using a device like this to measure the quality of a cup of coffee (it may be time for us to apply artificial intelligence to coffee making).
It reminds us of a similar debate on gun control, are guns the problem, or is it the way people use them? In this article, we will limit our discussion of this issue.
The second problem with this chart is that it is only valid for drip methods, which we often call pour-over. This chart is not for immersion methods such as French press or Aeropress and is unsuitable for Espresso.
Improved diagram from SCA
As we can see, there are nine regions (or boxes) with sensory attributes in each box like STRONG UNDER-DEVERLOPE, STRONG, STRONG BITTER, etc.
And the most exciting thing is that the middle zone is labelled as “IDEAL OPTIMUM” BALANCE” and is roughly understood as “the ideal optimal balance”.
So, to get a good cup of coffee, extract coffee. The ideal goal of the brewing control chart (in the original and the improved version) is to enter the “Ideal Balance” area (Ideal Balance). Optimum Balance).
According to the chart, “ideal” drip coffee will have total dissolved solids between 11.5 and 13.5 grams/litre with an extraction rate of about 18 to 22%.
These numbers are considered the “industry standard” and have remained unchanged for over 60 years; few studies have emerged to confirm these findings.
Your product must have an extraction ratio of 18 – 22% and a solute concentration of 1.15 – 1.35% using the 55 g/L dilution ratio recommended by SCA to achieve the Golden Cup Standard of the SCA.
Or you can use less (50 g/L) or higher (65 g/L) brew ratios but still stay in the “ideal” zone.
![Coffee Brewing Control Chart [Latest Version] - Helena Coffee Vietnam](https://live.staticflickr.com/65535/52179513263_4a92cdd529_k.jpg "Coffee Brewing Control Chart [Latest Version] - Helena Coffee Vietnam")
The chart is for SCA research purposes, with the unit of measurement for the phase ratio being Gram/Liter (E.E. Lockhart’s original 1957 edition used Gallon/Pound).
To get started, you need to know the concentration (TDS) of a cup of coffee (with a refractometer), so that you can locate the intersection of the horizontal line on the graph and the diagonal depicting the brew ratio used. It is used to make coffee.
At this intersection, draw a vertical line down the bottom of the graph. You can know the percentage of solutes at the corner with the horizontal axis.
While the Coffee Brewing Control Chart was relevant in its day, today, this classic chart has little application in modern brewing. Consumer preferences, brewing techniques and demand for speciality coffees are constantly changing.
In this development, there has been a trend towards higher extraction rates, driven by improved grinding equipment and brewing techniques.
If the coffee is extracted more evenly, a higher extraction level can be achieved without developing those negative flavours.
The problem that makes CBCC unsuitable in modern times is that it combines descriptive sensory analysis (what does coffee taste like?) with taste assessment (what do people like?). One person’s “under-developed” or “over-developed” coffee concepts may be someone else’s perfect coffee. The definition of “ideal” is still unclear. Ideal for whom? What makes the “ideal” cup of coffee? One person’s ideal cup of coffee may be very bitter, while another person prefers sweeter “ideal” coffee.
Professor William Ristenpart | sensoflavo.com
Scope of “Ideal Extract”
While the Coffee Brewing Control Chart was relevant in its day, today, this classic chart has little application in modern brewing. Consumer preferences, brewing techniques and demand for speciality coffees are constantly changing.
In this development, there has been a trend towards higher extraction rates, driven by improved grinding equipment and brewing techniques.
If the coffee is extracted more evenly, a higher extraction level can be achieved without developing those negative flavours.
![Coffee Brewing Control Chart [Latest Version] - Helena Coffee Vietnam](https://live.staticflickr.com/65535/52184733287_c98d16127a_k.jpg "Coffee Brewing Control Chart [Latest Version] - Helena Coffee Vietnam")
In 2013, the Specialty Coffee Association (SCA) published a study that reassessed the popularity of the ideal range of extractions, they found: Not much difference in preferences for different extraction levels.
In other geographical areas, consumer preferences for extraction rates also vary. In Milan, for example, consumers prefer high extraction coffee.
The researchers speculate this is because coffee drinkers in Milan are more used to Espresso and therefore choose the more decadent flavours of high-extracted coffees.
This led SCA to introduce a new extraction control chart to modernize the classic version of EE Lockhart.
Recent technological advances have extended the “ideal” extraction range to a new frontier. A series of studies by scientists at UC Davis Coffee Center has shown that the ideal content at EE Lockhart’s chart centre is not famous.
Instead, consumers prefer coffee with 19 – 24% extract and 1.1 – 1.3% TDS (Cotter et al., 2020).
Modern perspectives on sensations
Professor EE Lockhart has advanced our understanding of coffee making; His Coffee Brewing Control Chart has been widely used by coffee professionals worldwide to evaluate their coffees.
At the same time, thought leaders in the coffee industry have long recognized that the classical chart has a few shortcomings.
- The under-developed, ideal, and bitter borders suggest the misconception that small changes lead to significant differences in sensory properties. So the graph implies that coffee with 17.9% and 18.1% extracts will have considerable differences in sensory properties – which is absurd.
- The chart ignores many of the sensory attributes in coffee as listed in Coffee Taster’s Flavor Wheel. In a 2016 update, there were 110 different flavour attributes listed on Coffee Taster’s Flavor Wheel that showed the coffee had more flavour than “strong”, “weak”, and “bitter”.
- Finally, the sensory data used in the graph is based on 1950’s consumers, which is not representative of today’s coffee consumers.
To address the problems faced by the Coffee Brewing Control Chart, researchers from the UC Davis Coffee Center – California, the Specialty Coffee Association (SCA) and the Coffee Science Foundation 2017 decided to start a project to update and modernize EE Lockhart’s Classic Brewing Control Chart.
If you are curious, you can research more on the article on SCA. The new graphs are confusing, mathematically robust, and perhaps not meant for applications yet.
But for now, we think Dr EE Lockhart will be pleased that the ideas he pioneered in the 1950s serve as the foundation for coffee science today.
At the same time, we’re excited to follow our journey towards an updated coffee-making control chart for the twenty-first century.
Reference source:
- www.sca.coffee/Towards a New Brewing Chart | 25, Issue 13
- www.baristahustle.com/ Towards a Common Coffee Control Chart
- www.sensoflavo.com/The Upcoming Coffee Brewing Control Chart: Why the classic one needs an update?
- www.theatlantic.com/ How to Make Perfect Coffe