
Sensory Evaluation Profiling : The Role Of Sensory Evaluation And The Sciences Behind – The sensory evaluation began in the 1940s, as Meillgard et al. (1999) point out, as a result of wartime attempts to offer acceptable food to the American military.
This field is unique in that it employs human subjects as measuring instruments. It is a scientific method with the goal of understanding food items in order to optimize them and stimulate consumer choice.
It can be used at any step of product research and development, from identifying consumer drivers of liking to identifying sensory characteristics and the variables that influence them to quality control of selected sensory attributes.
Tasting, the major activity of sensory assessors, is something that everyone does on a daily basis, and it might be difficult for some people to think of it as a scientific field.
Sidel and Stone (2004) propose four blocks for sensory evaluation: “evoke, measure, analyze, and interpret.”
The discipline necessitates a clear definition of the objective, the controlled presentation of the stimulus (product or its ingredients), the selection of a methodology relevant to the objective, the execution of proper statistical analyses, and ultimately the interpretation of the results.
Sensory evaluation is influenced by a variety of academic areas. It is based on human physiology and psychology in order to better understand how sensations are interpreted, what influences this perception, and how we develop our final conclusion.
It uses the same approaches as psychophysics and statistics to discover the link between a stimulus and the experience it produces in the form of a mathematical function, equation, or representation (Meillgard et al., 1999).
The sensory analyst’s responsibility is thus to understand both the background and technique of the sensory tests while overseeing a pool of trained tasters with documented performance records, rather than to be the company’s expert taster.
She or he must be able to communicate effectively with stakeholders in order to do the most appropriate sensory testing. The sensory analyst finally becomes a coffee expert taster since she/he tastes a lot of off-records to the tests she/he conducts.
Conducting a scientific sensory test
We must construct sensory tests to get specific information in order to gain reliable and consistent data. We must also conduct the tests correctly, as well as the procedure of collecting and analyzing the results.
We set the test aims and find the best technique to obtain the required data in experimental design. We set up circumstances for the panelists to interact with the samples and provide the required data in order to execute the test. We can then use statistics to examine this data.
In experimental design, the first step is to assess what we already know and what we hope to learn. Then we can devise tactics for collecting the information we require. Above all, we must establish which parts we have control over and which we do not.
The information we don’t know but that the experiment will measure is referred to as “dependent variables,” whereas the inputs we can control are referred to as “independent variables.”
Furthermore, “extraneous variables” refer to any features of the experiment that we cannot control but that have an impact on the outcome. The most precise tests contain a “control” variable that is unaffected by independent variables and can be used to establish a baseline.
We must first qualify the panelists based on their recognized talents, experience, and training in order to conduct a sensory test and manage the test settings; the most general classifications include the “expert” taster and the “nave” taster. The panelists must also be familiar with the test’s operation, which may include training or a calibration session.
Sample preparation and presentation is fundamental difficulty in coffee testing. All elements that affect flavor must be considered, including green coffee selection, roasting, grinding, water-to-coffee ratio, water quality and temperature, and brew procedure (Fig. 18.2).
We must also manage the timing of the preparation and analysis because perceived coffee flavor changes as coffee cool. Samples must also be coded with a three-digit code, presented in a random or balanced sequence, and evaluated in repetitions and individually by panelists to reduce tasting bias.
Following the test, we must examine the raw test data without regard to the taster’s reputation. We can’t know whether a measurement is a random occurrence, thus we can’t learn much from it.
We can safely presume that the information is correct if we do two or three measurements with similar results. However, we must next use statistics to determine how accurate the measurements are (accuracy) and how consistent a measurement would be if repeated (consistency).
Statistics assess two components of the test: the accuracy or importance of the results, as well as their consistency. They can also assess the likelihood of an error.
A “significant” finding indicates that the measurement was not taken by accident and is reasonably precise. The “confidence” level, which measures the possibility that a measurement made again under the same conditions will be within a given range, indicates the measurement’s consistency.
The practical issue of developing forms, collecting data, and analyzing that data is also a barrier when undertaking sensory testing. Spreadsheets and computers have made it easier for us to organize and modify data in the last 15 years.
Advanced analysis can be done with statistical applications, and graphic programs can be used to present data in a more visual and sophisticated manner.
We can also enter data in real-time as the test progresses and replies are submitted in this age of social media and fast information. Tests become shorter, easier to analyze, and more accurate as a result of this.
When examining sensory data, it’s tempting to focus simply on inputs and outputs. Panelist comments, on the other hand, must be scrutinized carefully to verify that they accurately reflect panelist perceptions.
After identifying the objectives and the approach for acquiring information, we must also consider our resources, such as the number of panelists, sample availability, staff preparation, and the time period in which to conduct the test while creating a sensory test.
Several sensory tests for various objectives have been devised with these requirements in mind by research professionals.
Rather than creating a test from scratch, it is usually more efficient to use one of these standardized exams because they are well-known, simple to teach, and include specific statistical processes for data analysis.
Sensory tests
When compared to other sciences such as biology, chemistry, and physics, the use of formal experimental methods for sensory testing is relatively new.
The methodologies have evolved in tandem with advances in psychology and research into how humans respond to diverse stimuli. The “classic” approaches are those that have been in use for a long time; newer advancements will be highlighted as well.
The sensory experience can be evaluated in two ways: qualitatively and quantitatively (Meillgard et al., 1999). “Qualitative” approaches attempt to define a sensory experience by contrasting it with a standard or a well-known experience.
Attributes, characteristics, descriptive terms, descriptors, or terminology are all terms used to describe qualitative aspects. “Quantitative” approaches employ a variety of scales that allow the analyst to describe their level of experience on a scale.
The most frequent are intensity (for example, assessing a sample’s sweetness on a scale of 1e10) and numerical or verbal scales (like very much, like slightly, dislike, etc.) that can be easily converted to numbers. The majority of sensory tests combine qualitative and quantitative ratings, while one does not.
The purpose of testing determines the sensory test to use. There are a variety of tests developed to address certain issues that arise frequently while deciding on a food or beverage. The following are some of the most common classifications and the questions they attempt to answer:
- Are two or more samples the same or different from one another? In this case, “difference” or “discrimination” tests are used.
- What are the flavor attributes of a coffee and the intensity of those flavor attributes? This is answered using “descriptive” methods comprised of a qualitative description (which flavor attributes are present), and possibly a quantitative rating of the intensity of those attributes.
- Does this coffee meet a standard profile or set of standards? These tests involve the comparison to a known standard or an assumed standard. Grading methods fall into this category, as do quality control differences from control/standard tests.
- How well is the coffee liked by those consuming the sample? These are known as “hedonic” tests since they explore the liking of coffee, or how it affects the consumer.
To better understand the coffee complex flavor (Fig. 18.2; Sunarharum et al 2014), including its taste and mouthfeel expression, all of these methods can be used at all stages of the coffee value chain to study treatment and effect in agriculture, postharvest, green physics, blend, roast, extraction, packing and shelf life, preparation, and serving.
Only a few tests will be explained, including the most common and widely utilized as well as the most inventive, all of which have a place in the coffee industry.
The classic methods
Difference or Discrimination tested example of the triangle test
Differential or discriminating tests come in a variety of forms. All of them are based on a comparison of two or more samples, with the analyst being asked to make a specific decision.
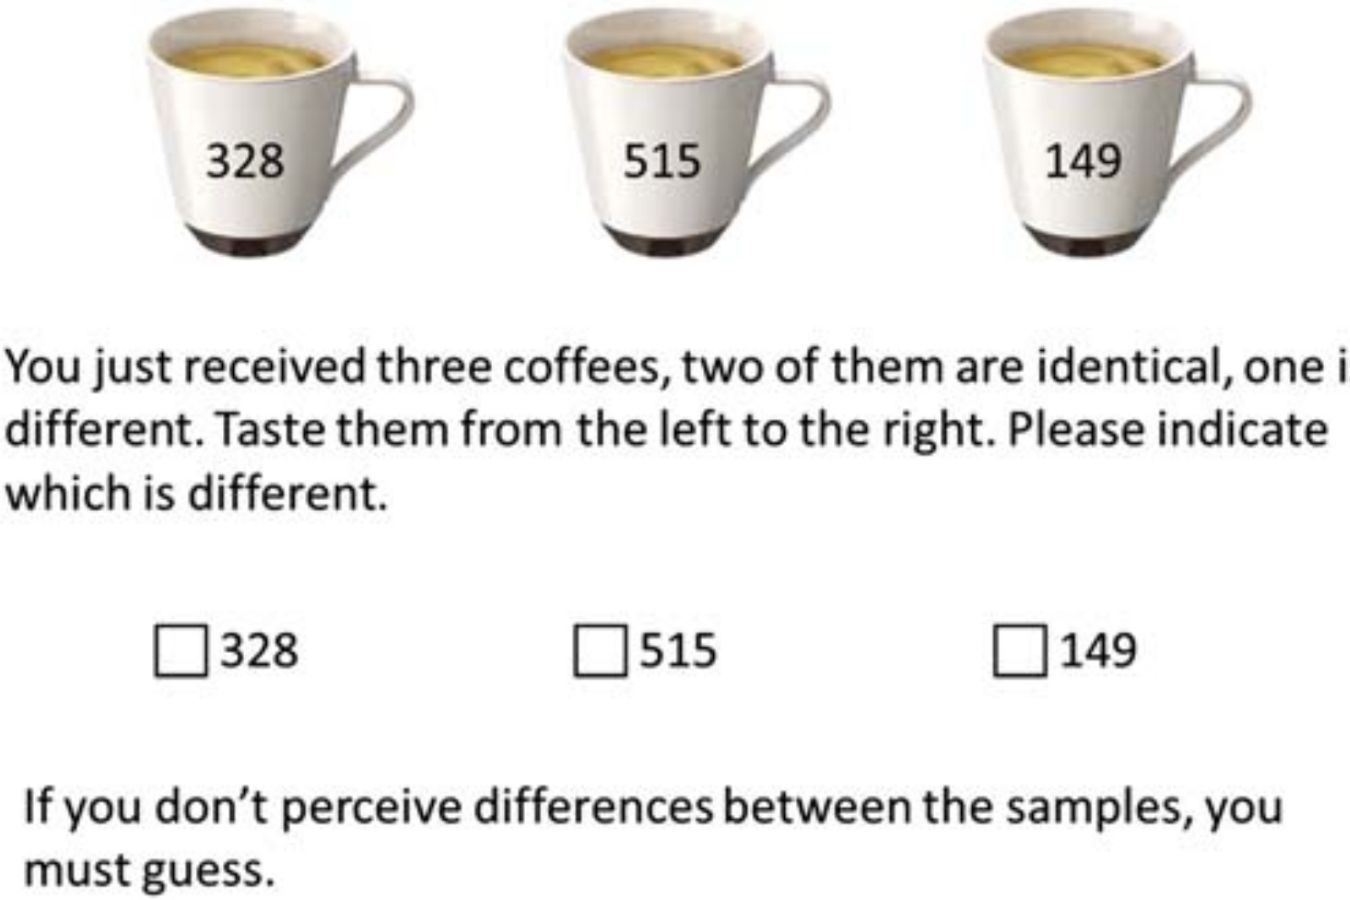
The “triangle test,” in which one of three submitted samples differs from the other two, is the most well-known (Fig. 18.3). Because the analyst has a one-in-three probability of predicting the correct answer, the test must be repeated numerous times to evaluate significance and confidence levels.
The paired comparison and duo-trio tests are examples of this sort of test. Palate fatigue is a problem with this sort of testing because numerous sets of samples must be submitted to assure statistical validity. It’s possible that the assessors will get too fatigued and desensitized to make an appropriate assessment.
In a series of triangle tests, regular coffee drinkers in Brazil were able to discriminate between clean and dirty coffees when the latter contained as little as 2.3e2.5 percent of a mixture of black and white beans.
Immature, and sour defective beans (Deliza et al., 2006). Another way of using the triangle test could be to evaluate whether two varieties such as Castillo and Caturra are perceived the same or different by a panel of experts or by a panel of consumers.
As clear as it may seem, discriminative tests are essential before moving on to descriptive testing, as those exercises would be useless if the panel is unable to distinguish between the samples.
Descriptive TestingdThe Quantitative Descriptive Analysis
Variants exist for descriptive quantitative analysis among which the SpectrumTM Descriptive Analysis and the quantitative descriptive analysis (QDA) (Stone et al., 1992).
The QDA is most likely the most widely utilized descriptive testing technique. It all starts with determining taste qualities, which can be done using a pre-existing language such as World Coffee Research’s “Sensory Lexicon” (2016) or the Specialty Coffee Association of America’s (SCAA) “flavor wheel,” or through a free-association panel brainstorming session.
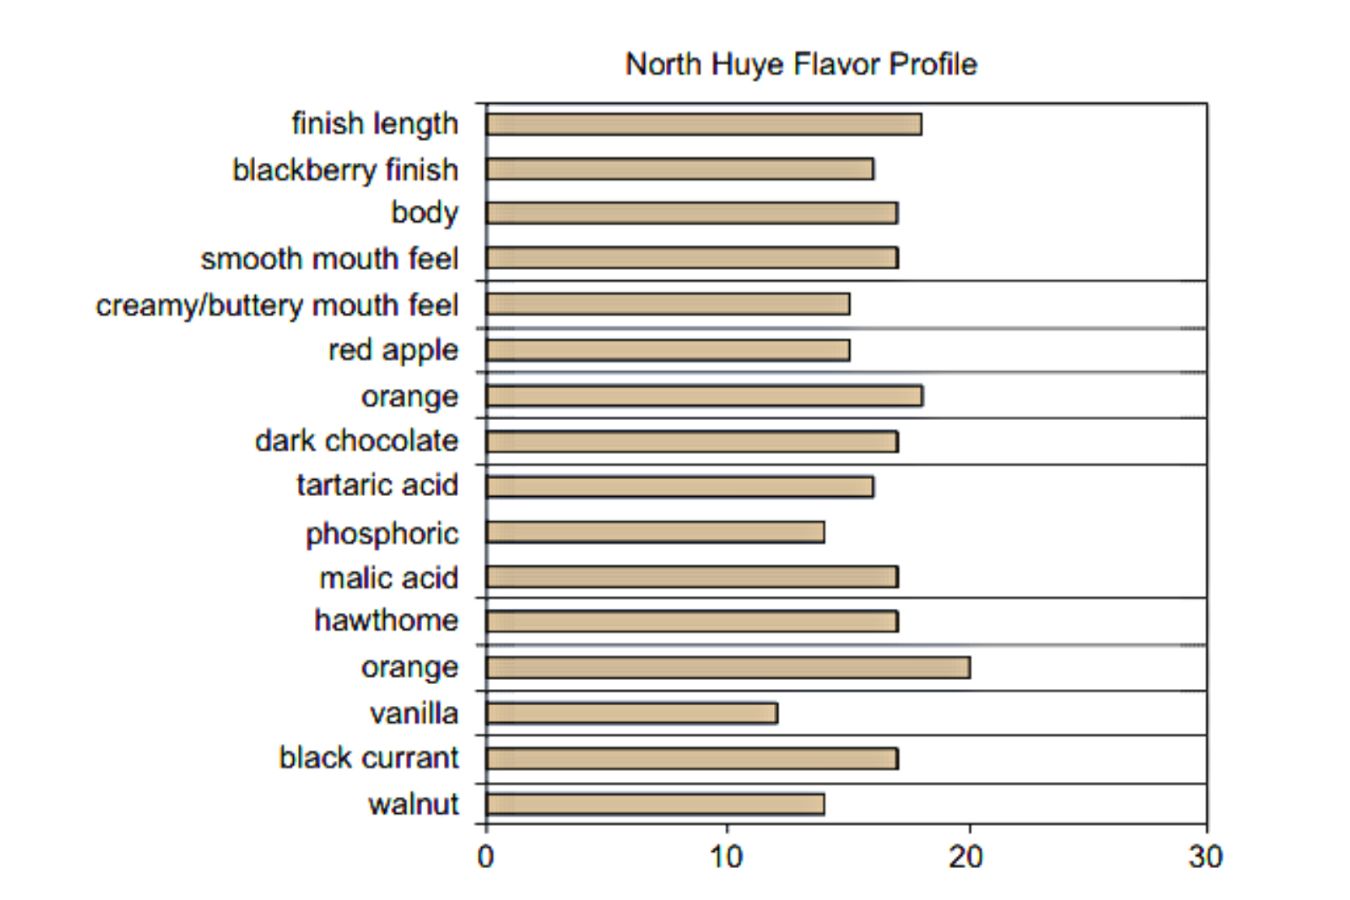
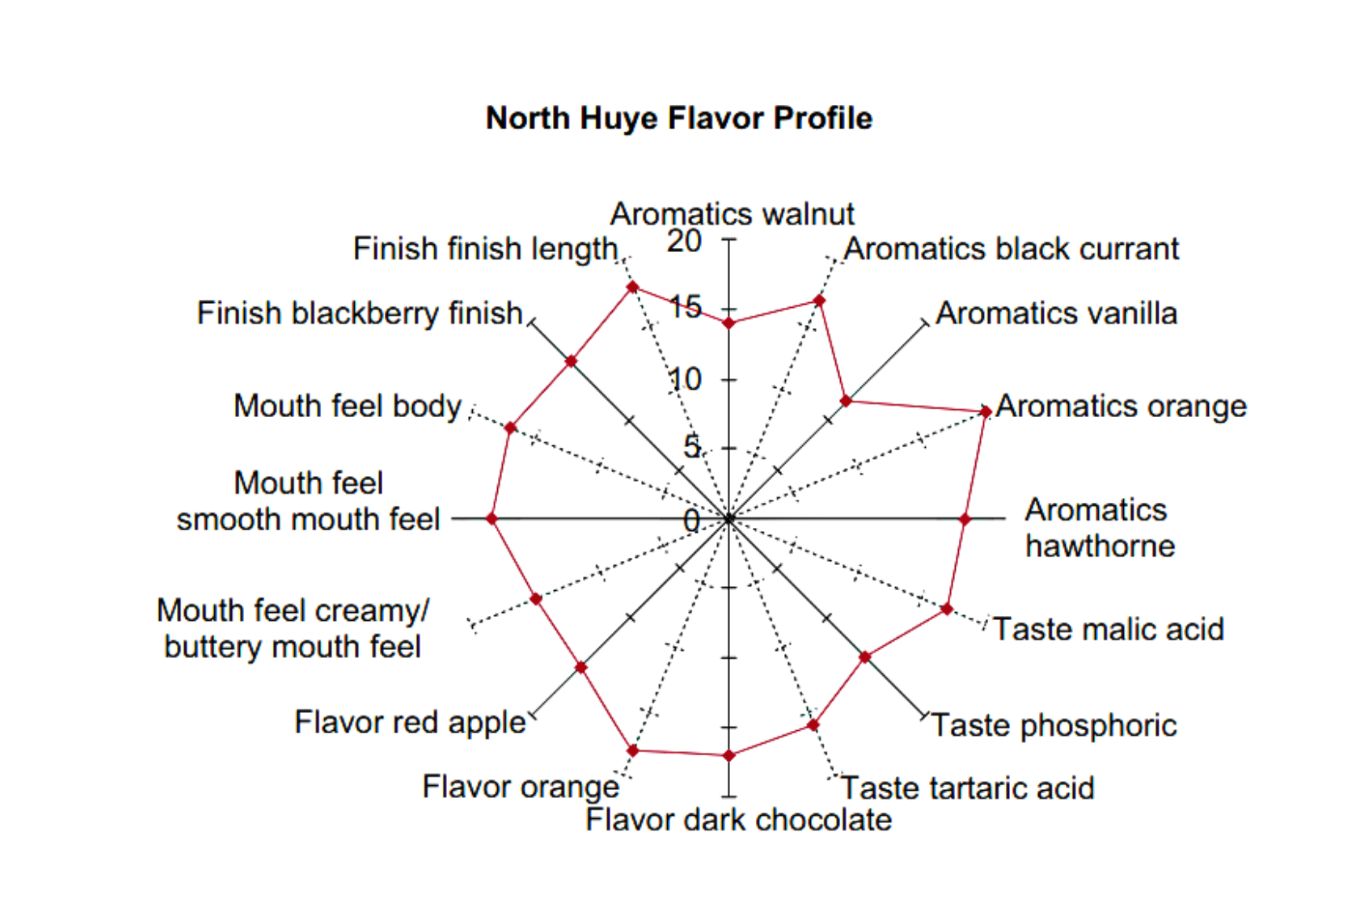
The latter requires several sessions, and once a consistent language has been established, the traits are quantified in terms of intensity. The purpose is to create a “flavor profile” that identifies flavor characteristics in order of appearance, with intensity indicated by the distance from a given location (Figs. 18.4 and 18.5).
Principal component analysis is frequently used to compare descriptive data. This multivariate method combines the distance between sensory characteristics across samples and the distance between samples across sensory attributes to construct two-dimensional spaces on which the samples and attributes can be mapped.
Rwanda (Songer, 2008).
(Songer, 2008)
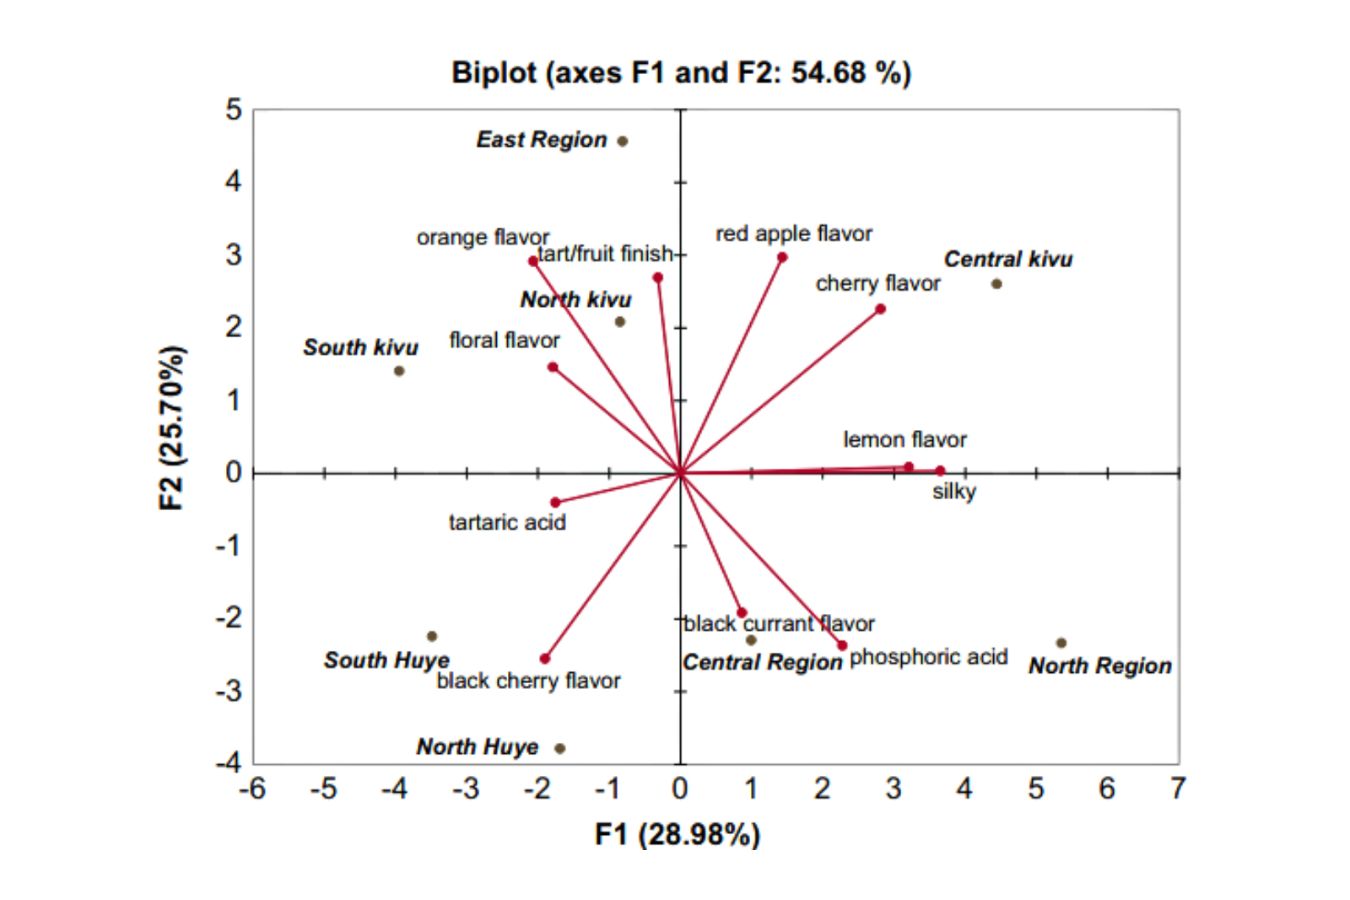
Figure 18.6 shows how the QDA is used to compare producing regions in Rwanda and so demonstrates the country’s internal variability in taste profile.
Because the North Huye and South Huye samples are close together in the lower left quadrant, one can assume that they are comparable, however, the East Region sample (placed in the top left quadrant) is considerably distinct from both Huye samples due to the enormous distance between them.
It’s also plausible to conclude that if a black cherry flavor is detected (lower left quadrant), red apple or red cherry flavor descriptors are unlikely to be detected in the same sample (upper right quadrant). It’s important to remember that the chart only accounts for about 55% of the variance between the samples (28.98 percent 25.70 percent).
The QDA has a wide range of applications. Wet-processed robustas were found to be more acidic and fruity than dry-processed robustas, which were reported to be more rubbery, burned, bitter, and woody (Leloup et al., 2004).
A QDA defines the clean coffee as sweet with body texture and the coffee blended with defections beans as much more bitter, astringent, chemical, green, and burnt after measuring the threshold of detection of defections bean in coffee by Brazilian consumers (Deliza et al., 2006). (Deliza et al., 2008).
Focusing on the final mode of preparation at the consumer end, QDA demonstrated the impact of milk quality added in-dash onto the coffee beverage (Steinhart et al., 2006): double homogenized milk with lower fat content and lower fat globules increased coffee-related attributes, whereas milk with added casein decreased those same attributes versus whole milk.
The QDA also monitored the shelf life of roasted and vacuum-packed coffee beans, concluding that alterations can occur during storage (Kreuml et al., 2013). When compared to freshly roasted coffee, the 9-month-old coffee had less intensity on the favorable flavor qualities and had higher bitterness and sourness. This was considerably more pronounced at 18 months.
Accurate descriptive analysis necessitates a significant amount of time and knowledge of attribute references. It’s frequently done while creating a set of standards for a product, conducting research, designing a precise product, or tracking a critical product on a regular basis.
When there’s a chance to add significant value to a product, such as improving a blend by changing a component, isolating a particularly popular flavor attribute preferred by consumers, varying the roast profile, or simply benchmarking your lead product against others on a regular basis, such a close evaluation of a product is most useful.
Quality Control and Grading
The sample-to-standard test is the simplest fundamental way of determining if a sample or collection of samples meets a standard. A “gold standard” depicting the ideal sample is provided, similar to the duo-trio test, and the samples of interest are compared.
Frequently, the product’s most essential flavor features are specified, and the panelist is asked to compare a newly manufactured product to the standard.
In a quality control test, for example, recently roasted samples might be compared to the “gold standard” to check that the correct degree of the roast was achieved and that the desired balance of flavor qualities was present.
Grading systems are quality control techniques that are used to categorize a sample based on what is discovered. For example, a set of tests are performed on green coffee for the “Q” grading procedures, including a defect count on a randomly selected sample and a sensory test in which a coffee must score an “80” to be qualified as specialty (for details see Chapter 8).
Hedonic Tests
Consumers who are likely to buy the goods undertake the majority of emotional (also known as “hedonic”) tests. Consumers are asked to rate each sample using a conventional 9-point or 7-point scale ranging from “dislike highly” to “neither like nor dislike” to “like extremely.”
There are other comparison tests, such as those in which customers are asked to rank a group of samples from most preferred to least desired, or are given a set of two or three samples and asked which one they prefer. Some tests employ the just about right to focus on a specific feature, such as strength or intensity: customers are asked to assess if a product is strong or intense.
These tests are useful for determining whether new items, such as the international cappuccino and latte or the advent of cold coffees, are acceptable to consumers in a certain country.
The reaction of customers to the little-known iced coffee was tested in France, a traditional hot black coffee country (Petit and Sieffermann, 2007).
Plain iced coffee and milk ice coffee, the two versions tested, were both highly received. The milk variety was rated higher and described as sweet, creamy, and milky, compared to the plain varieties, which were regarded as watery, light, and bitter.
Novel Methods
Several methods, like the QDA, described earlier, have been created as alternatives to classical descriptive analysis, with the advantages of flexibility, speed, and the ability to be conducted by experts, trained assessors, or directly by untrained consumers (Varela and Ares, 2012).
Those new methodologies will be used in coffee, where training tasters is a difficult process, recording directly consumer perception is an obvious prerequisite, and where various variants with minute sensory differences between items can lead to large consumer preference changes.
Sorting Task and Projective Mapping
The sorting assignment was the first approach devised with this concept in mind. This method was developed in psychology to better understand how humans perceive and categorize the world (see Coxon, 1999 for a summary and historical context). Lawless was the first to use it on a food product (1985).
Single sessions are used for free sorting jobs. All of the products are exhibited on a table at the same time and in a random order for each assessor.
Assessors are requested to examine all of the goods for scent and/or taste (depending on the study’s aims) before sorting them into mutually exclusive groups based on product-perceived similarity.
Assessors are allowed to use whatever criteria they wish to accomplish their sorting, and they can create as many groups as they want with as many goods as they want in each one.
Assessors can be asked to submit terms to describe each group they made once they’ve completed their groupings. The initial stage in data analysis is to create a similarity matrix by counting the numbers.
Following that, the similarity matrix is subjected to multidimensional scaling (MDS). MDS creates a spatial representation of product similarity in which products are represented by points on a map, with assessors judging two products that are close on the map to be comparable.
After that, the descriptors associated with the various product groupings can be projected into the similarity map. This is accomplished by first calculating how often each descriptor was used to describe each product.
The descriptors assigned to a group of items are assigned to each product in the group, and several assessors’ descriptors are deemed to have the same meaning. The descriptors are then projected into the similarity map by computing the correlations.
To investigate the impact of the coffee profile and the amount of milk used on the final beverage, the sorting task was applied to the milk dash, cappuccino, and latte recipes (Puget et al., 2010).
The overall profile of the milk dash beverage matched that of the coffee utilized. For cappuccino, four final beverage groups were defined based on both the coffee intensity level and its aromatic dominance, however for a latte, only two categories were found based on the coffee intensity’s ability to show or not appear in the high milk quantity.
Risvik et al. (1994), who created the projective mapping, also known as napping (Page’s, 2003, 2005), proposed an alternative approach to express product similarity around the same time as the sorting job.
All goods are shown simultaneously, as in the sorting assignment, and assessors are asked to look at, smell, and/or taste each one before placing them on a sheet of paper according to their similarities or differences.
Assessors are told that if two products are believed to be identical, they should be positioned extremely near together, and if they are perceived to be different, they should be placed very far apart. There are no more instructions as to how the samples should be split in this space, therefore each assessor must figure it out for himself.
Assessors can be asked to characterize each product by writing a few words immediately on the sheet beside the products after they’ve placed them on the map.
Each sample’s X and Y coordinates are recorded on each assessor map and combined in a product by assessors table, where each assessor contributes to columns reflecting his or her X and Y coordinates, respectively.
To create a sensory map of the products, the matrix is subjected to a multivariate analysis such as generalized Procrustes analysis or multiple component analysis. There is now no coffee-related magazine accessible, however, there is plenty of wine.
Flash Profile and Check-All-That-Apply Questionnaires
The disadvantage of the quick approaches outlined earlier is that they are focused on similarities, therefore product descriptions are a secondary concern.
Instead of focusing on the analytical description of the products, flash profiling (Delarue and Sieffermann, 2004) is a method that focuses on the analytical description of the products.
Free choice profiling (FCP) and ranking methodologies are combined in this descriptive method. It is based on the well-known principle that comparing products is easier and more natural than evaluating them on an absolute scale. There are two sessions in the Flash profile.
The entire set of products is presented to each assessor at the same time in the first session, and they are then asked to observe, smell, and/or taste the products (depending on the study’s objectives) and generate a set of attributes that should be sufficiently discriminant to allow ranking these products.
Assessors have complete freedom to create as many descriptive qualities as they desire. In the second session, the assessors are asked to score the products on each of their features from least to most important. The data from the assessors’ rankings are then gathered and evaluated using multivariate analysis techniques such as the general Procrustes analysis or multiple factor analysis.
The key benefit of the flash profile is the small number of judges necessary (about 10) and the quick turnaround time for a product map.
The interpretation of sensory terms, on the other hand, is a challenge due to the vast number of terms generated and the lack of definitions and evaluation procedures.
As assessors, product specialists may be preferred to limit this problem. In terms of napping, no coffee-related publications have yet been discovered, although there are a plethora of wine-related publications.
Liu et al. (2015), for example, looked at how well flash profile and napping performed with and without training for expressing tiny sensory variations in model wine.
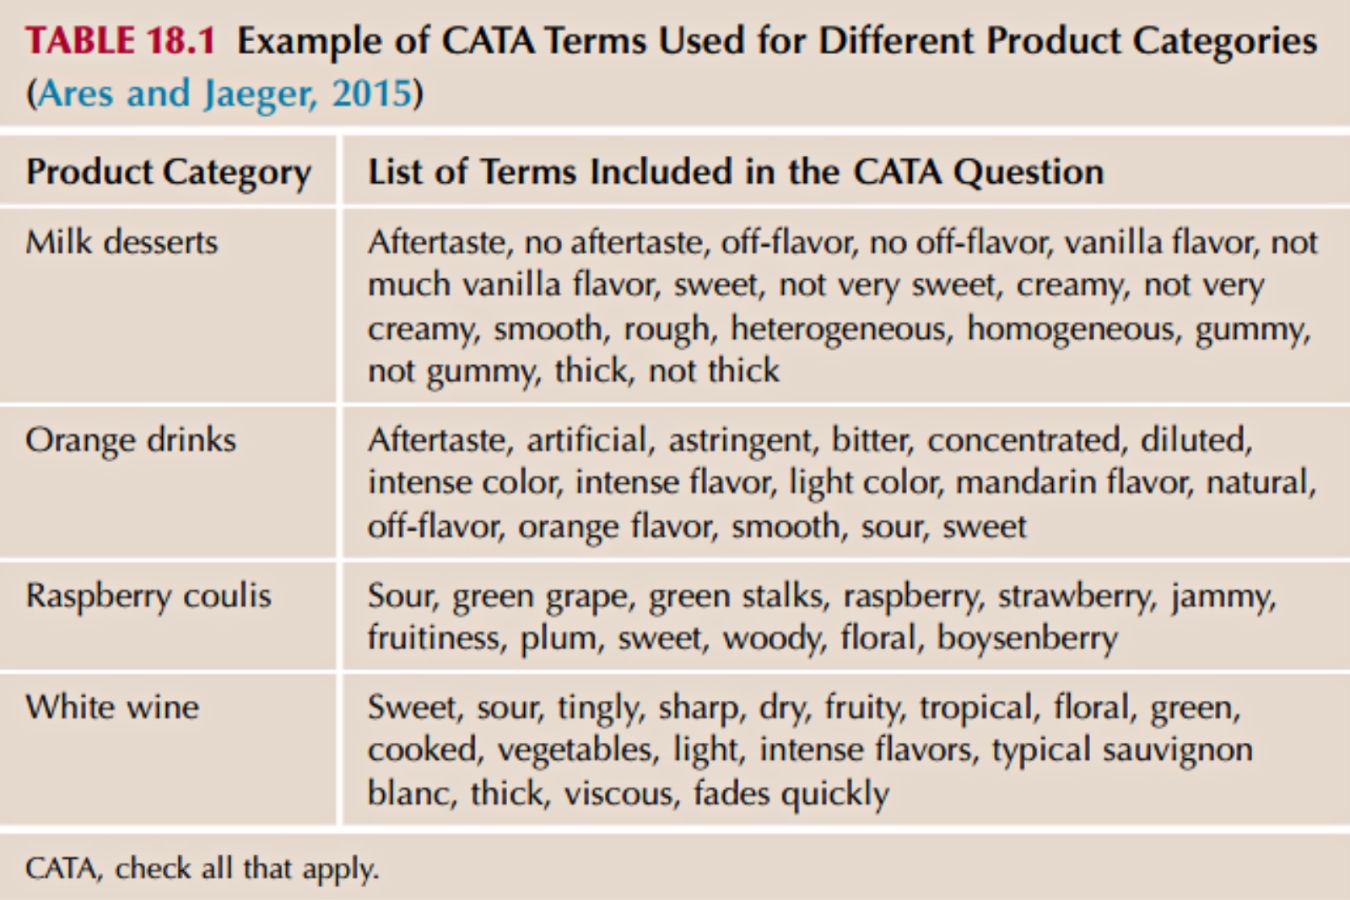
The check all that apply (CATA) method can produce maps that are simple to read and understand. This approach was originally employed in marketing research to evaluate consumers’ perceptions of different brands, and it was based on Coombs’ (1964) work.
It was recently introduced in sensory evaluation to assist optimize food goods by understanding consumer preferences. A CATA questionnaire consists of a list of attributes (words or phrases) from which assessors should choose all of the attributes they believe are acceptable to define a particular product during its evaluation.
According to a Latin square or a randomized design, products are shown to the assessors one at a time. Assessors are asked to rate each product and check the features that best characterize it for them on a list. Assessors have the option of checking as many traits as they want. The traits aren’t limited to sensory features; they could also be related to hedonic and emotional factors, as well as product usage or marketing concept compatibility.
The number of assessors who used each feature to describe each product is then counted and a frequency matrix is created, which is then submitted to a correspondence analysis (CA) (i.e., factor analysis for qualitative variables).
Although it necessitates a large number of participants (typically consumers), CATA’s key advantage is its ease of use, both for the assessor and the researcher.
The most significant disadvantage is that it requires an a priori list of descriptors. This list can be compiled from the literature (or past studies) or gathered through a focus group before the test.
Table 18.1 gives some examples of CATA terms used for different product categories (Ares and Jaeger, 2015)
Pivot Profile
The methods discussed earlier, with the exception of CATA, do not allow data aggregation from various research because all samples must be supplied at the same time.
When the number of samples is too large for a single session and samples must be compared in different places and times, this can be an issue.
One option to get around this issue is to utilize a comparison method, which is easier for unskilled assessors, but instead of comparing all of the products together, compare them to a stable reference.
Pivot profile was created in the field of wine description, and it is based on the concept of free description approaches, which are commonly employed in this industry (Thullier et al., 2015).
Assessors are given a pair of products, one of which is the reference (clearly labeled as such) and the other of which is the product to be evaluated.
Assessors are expected to compare the reference and the product by observing, smelling, and tasting them, as well as writing down each feature that the product contains in a smaller or bigger amount than the reference product (e.g., less sweet, more astringent)
The process of data analysis begins with the grouping of synonyms and, if desired, the classification of terms by categories. Then, for each term and product, negative and positive frequencies are computed, and the negative frequency is subtracted from the positive frequency.
Finally, the resultant score is translated to only produce positive results. To produce a sensory map of the products, the resulting matrix is subjected to correspondence analysis.
Pivot profile appears to be a particularly viable strategy for complicated items such as wines and coffees, where experts have a strong heritage of free description. This method may offer a compromise between expert practice and sensory evaluation, making it well suited for coffee description.
et al., 2015)
The map was produced by applying the pivot profile in one session to five Champagne wines with varying percentages of wine variety (Pinot Noir, Pinot Meunier, Chardonnay), percentage of reserve wine, and year of bottling, and rated by ten wine experts is shown in Fig. 18.7. (Thuillier et al., 2015).
Applying Sensory Methods in a Professional Situation
In the food and beverage sector, the approaches outlined before are used to generate new products, concepts, quality control of present items, and product improvement.
There are others who are accessible and have their own areas of interest. The temporal dominance of sensation tries to identify the sensory features and intensity that predominate during the duration of the evaluation.
Before rating the intensity of the attributes in the products, the FCP allows each assessor to choose the attributes that are important to him or her.
Ranking methods are part of the traditional method; they are simple for tasters to use and produce reliable findings when comparing a product to others.
The process of developing a new coffee begins with the creation of many prototypes for sensory testing and consumer acceptance. Once the consumer’s preferences have been determined, the coffee may be prepared with certainty, and quality control processes can be developed.
With the introduction of the new sensory approaches mentioned earlier, the consumer’s comprehension of whether he or she would enjoy a new coffee profile, why he or she likes a taste, an idea, and how he or she would like it best becomes broader and more accurate.
Furthermore, with the addition of those new sensory approaches to the previously long-established ones, any sort of organization of any size can assess which way would best suit its purpose and target while staying within budget and schedule constraints.