What Is Coffee Roast Graph? – Roasting basics roast for those familiar with the notion of the Roast Profile in the coffee roasting process baked.
Then at least once “troubled” with the roasted graphs (Roast Graphs), which at first appear very theoretical and dry, but once you comprehend these curves, you will quickly recognize the significance of Roast Graphs in assuring consistent quality in every coffee roaster.
In addition, we will gain a deeper understanding of the meaning and impacts of coffee roasting graphs, as well as become more familiar with the main stages in temperature graphs, in this section.
A coffee roasting curve is a useful tool for gaining a better understanding of the roasting process. A typical curve shows the roast time (typically in minutes) on the x-axis and the roaster temperature (in °C or °F) on the y-axis.
For reasons that will become clear later, the curves may additionally show growth on a secondary axis.
To the uninformed, the graphs below may appear to be a bowl of spaghetti, but once you grasp each and how it relates to the others, the curves will make sense and tell an experienced operator a lot about what is going on inside the machine.
Each curve represents the events of the roasting coffee in pictorial form.
What is the graph for coffee bean roasts?
If you think of a Roast profile as a “process record” that records the essential parameters for the coffee roasting process, you’re right.
The most significant aspect of the Roast Profile is a system of numerous graphs known as Roast Graphs, which include graphs displaying (equipment temperature and grain temperature), humidity, mass, and pressure in real-time (by roasting cycle), with the temperature graphs being the most critical.
The role of the “Roast Graph” in the roasting of coffee
Most of us who enjoy coffee and the divine process of each bean coffee roasting in the oven find it annoying that we can’t coffee roast a decent batch like we used to.
Industrial roasters, on the other hand, require uniformity throughout medium-quality roasts rather than rotating between superb flavors and burnt batches.
In the first place, Roast Graphs provide a plant-reliable way to keep each roast’s quality consistent. The more thorough a roasting is, the more accurate it is for reproducing the time and temperature in each roaster.
Data recorders not only help you maintain consistency, but roasting charts also help you identify particular aspects that affect the final flavor of your coffee, such as heat loss and convection. atmosphere, of heat growth, pressure, and so on to put it another way, roasting helps you understand the fine-tuning required to get the desired flavor, as well as what drives the roasting process. a few taste variations

A graph of temperature during coffee roasting (grams light roast )
There are a variety of techniques to record a grams light roast, but the majority are based on the basic idea that transducers (sensors) in the roasted beans continuously collect data and communicate it to the computer for encoding and charting.
Most current roasters come with built-in sensors, and Roast Profile recording software is widely accessible. However, they are all represented in two primary graphs:
- Control curves: This is a that displays factors that you can control directly, such as temperature, airspeed, and airflow.
- Reading curves (ideal roast curve): These are variables that are measured indirectly and those you cannot control directly, such as coffee temperature, air temperature, rate of rise (of Rise – ROR), relative humidity (RH), and so on.
* Because each Roast Profile recording program has its own set of features and interface, the information above is just intended to be used as a guide.
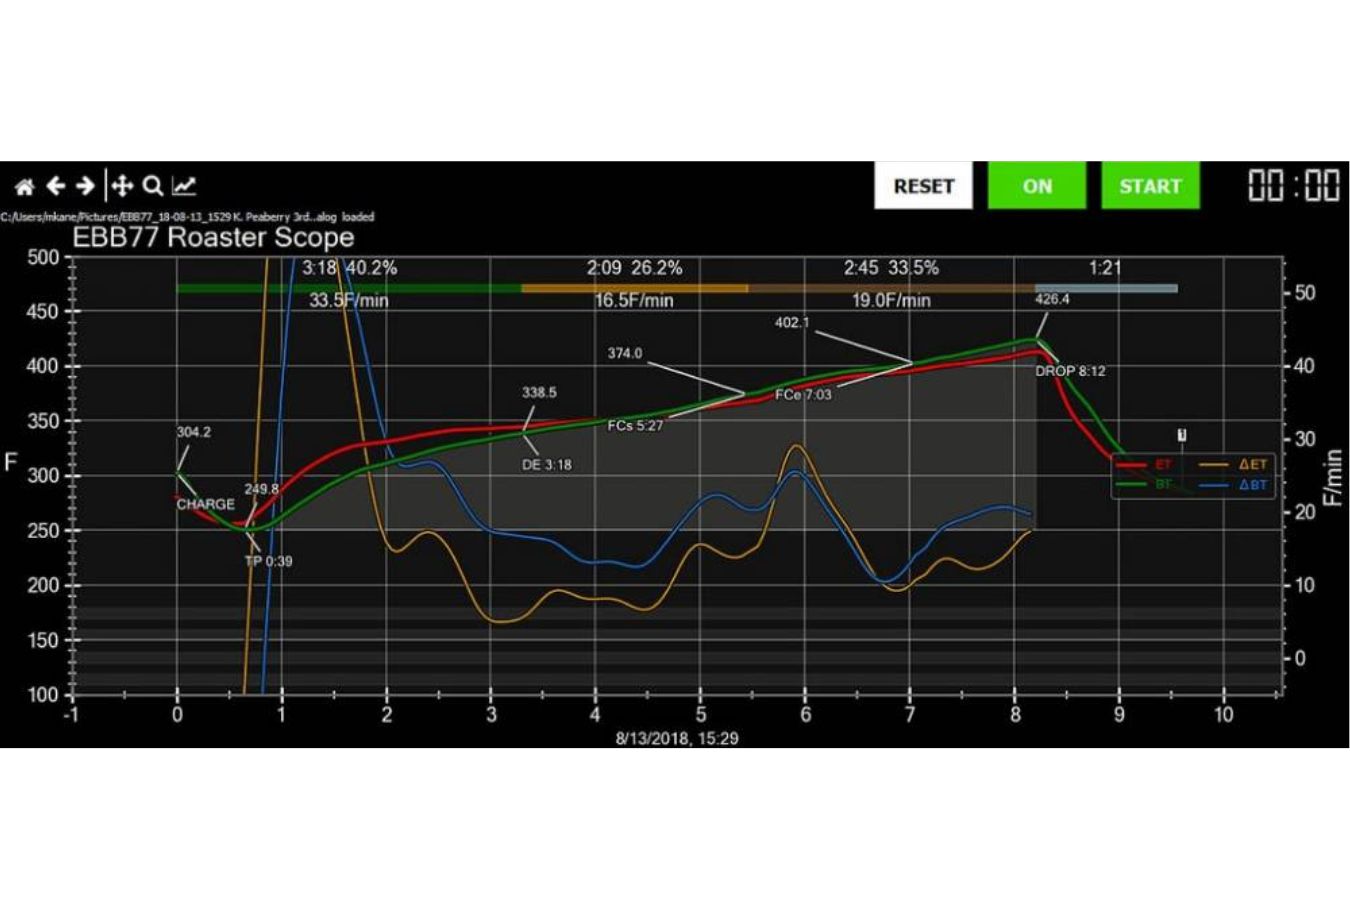
Particle temperature (red) and device temperature line (blue) in a basic heat (blue)
It’s not easy to truly comprehend and use all of the above criteria, and if you display all of these graphs on a computer screen while roasting, you’ll easily miss the most interesting aspect. in each and every coffee bean As a result, we’ll concentrate on certain fundamental notions that practically every coffee Roasted use as a useful tool.
The temperature of the coffee (bean mass temperature) (bean curve) and the temperature curves figure of the air (Air Temperature) dark – dark
Because most roasters use the same idea of heating the air using a heat source (gas, oil, or electricity) and then sending that air to heat the coffee beans, there is always a temperature differential. in this process to some extent For easy control, we must measure both the temperature of the air and the mass of the particle at the same time.
The heat loss ratio is determined by the temperature differential between the air and the temperature (or the distance between the two graphs); narrow intervals between the two curves indicate a high air convection rate.
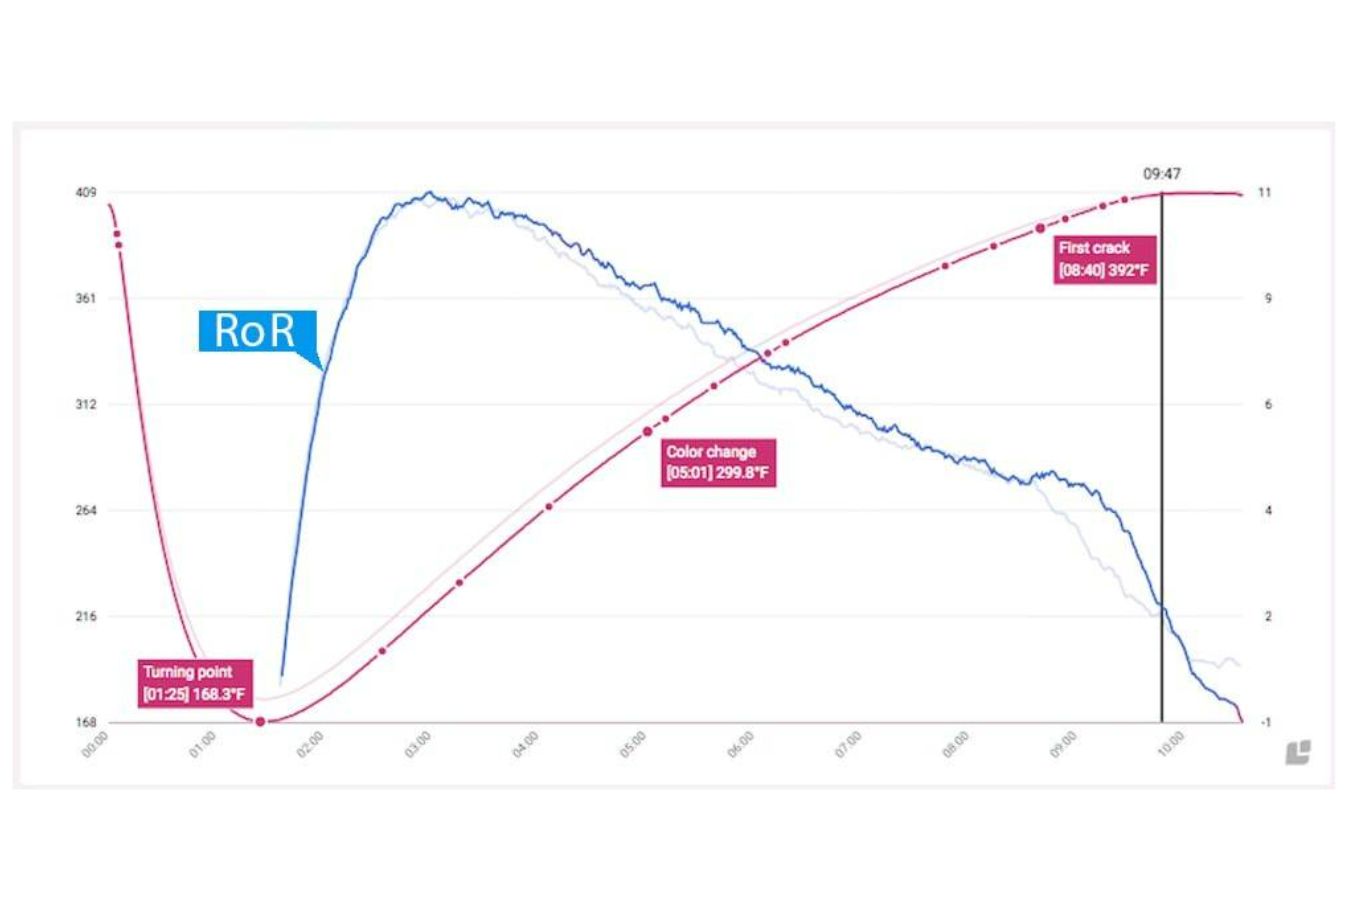
Temperature Rise Rate (RoR) – The rate at which the temperature rises
Simply explained, when the coffee beans are new, they have the ability to absorb a lot of heat from the roaster, causing the quantity of heat generated by the roaster to rapidly/per second grow. The coffee beans heat up gradually, and because the temperature difference ratio is lower than that of the machine, the beans will heat up more slowly/per second. That process is represented by ROR, which is a ramp.
Observations on RoR during roasting:
Faster coffee roasts progress with a higher RoR. A lower RoR indicates that the coffee is being roasted at a slower .
Many factors influence the proper RoR, including the type of coffee, desired taste trends, and roasting equipment…
ROR Max, ROR 1st Crack, and ROR End are three major milestones in the of temperature rise (typically degrees/min) (these contents will be presented in more detail in the following article).
You won’t have the rule to follow with RoR, and you won’t have a high or low RoR to look at, but you will understand how this indication affects the taste of coffee in the roaster. Once you’ve mastered RoR, you’ll have a lot of options for bringing out the various flavors in your coffee.

The temperature graph’s main stages
As previously said, the temperature is the most important of the many graphs and parameters in the roasting process, because after all, the roasting process is simply heating for the changes. physical and chemical in the grain structure, thus we can see how far the coffee beans have acquired flavor at any one moment on the temperature chart, and there are some temperature milestones to keep an eye on, such as:
- Temperature of Charging
- Before the coffee is added to the roaster, the temperature of the roaster (particularly the roasting drum) is measured.
- Turning Point (TP) – heat transfer phase: As you may guess, when room temperature green coffee is preheated by the roaster, roast temperature curves drops quickly before quickly increasing again at the Turning Point.
- The coffee beans will shed a large quantity of moisture during the roasting process, the carbohydrate components will caramelize, and a variety of other complex reactions will produce CO2. Moisture and CO2 are released along the grooves of the beans when the coffee reaches a particular temperature, causing cracks accompanied by a minor crack; this is the stage Called First Crack, often known as bang.
- The first identifies each grain’s entire taste evolution.
- Roast Development (RD) – Temperature for development: The flavors of the coffee will grow continuously during the roasting process, but only for a brief time (from 45 seconds – to 1 minute) The flavors alter considerably after the first crack. from the characteristics of the fruit (acidity) to the characteristics of the seeds (Body).
- Natural acidity is thought to represent the coffee’s “fruit” character, with a high concentration of fruit-related flavors known as Acidity, while
- The body is thought to represent the “grain” character. The aromas of smoke, cocoa, chocolate, and wood dominate. You can lengthen or shorten the Roast Development process depending on the desired flavor.
- End Temperature (ET) – End Temperature is a term used to describe the temperature at which something ends.
- The temperature at the end of the roasting process.
Roast graphs in summary
Roast graphs in general, and temperature graphs in particular, are a tremendous challenge for coffee aficionados since there is so much data to collect and absorb after a succession of infinite ideas.
However, as you begin to deal with air temperatures, rising rates, initial cracks, and other aspects of the roasting process, you will develop a true understanding and mastery of how flavors form. So, instead of becoming discouraged, read it again and then begin your own roasting journey.
Reference source:
- www.williamstownroasters.com/ Understanding Coffee Roasting Curves
- www.perfectdailygrind.com/ Coffee Roasting Essentials: A Guide to Rate of Rise (RoR)
- www.perfectdailygrind.com/ Roaster Basics: An Explanation of Roast Graphs
- www.perfectdailygrind.com/ The S-Curve Roast Profile: Exploring Roasting Basics
d