Roast Graphs – The Basis Of The Coffee Roasting Process: At least once, you’ve messed up with roast graphs, which may seem very theoretical and dry at first, but once you understand these curves, it’s easy to see the value of Roast Graphs in ensuring the consistent quality of roasting.
And in this section, we will better understand the meaning and effect of roasting graphs while familiarizing ourselves with the main stages in the temperature graph. Learn about Roast Graphs with Helena.
What Is A Coffee Roasting Graph?
Suppose a roast profile is considered a “process record,” recording the necessary parameters during the roasting of coffee.
The most important part of the roast profile is a system of many graphs known as Roast Graphs, which include expression charts (device temperature and particle temperature), humidity, volume, pressure, and other variables in real time (according to the roasting cycle), with the temperature charts being the most important.
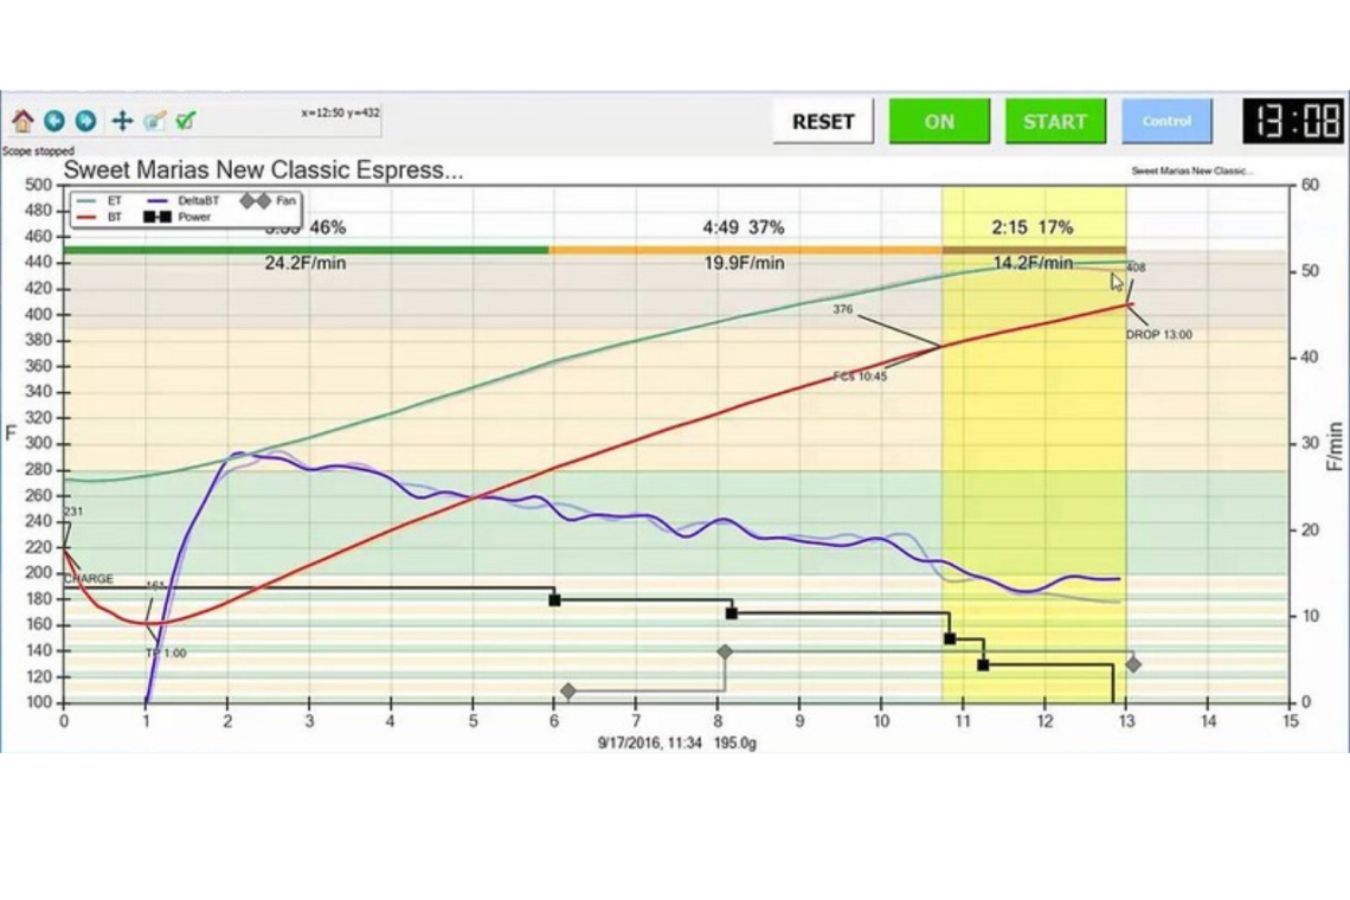
Several charts are used to represent different reactions during roasting, such as the Rate of heat increase (RoR), the Rate of environmental heat change, the emission temperature chart, etc.
But today, the focus is on the particle temperature graph and how to understand it. This is the most classic graph of Roast Graphs.
The role of “Roast Graph” in the coffee roasting process
Most of us, coffee lovers and lovers of the divine process of each grain in a roaster feel uncomfortable not being able to roast a batch as well as we did before. On the other side, industrial roasters also need consistency on medium-quality roasts rather than alternately creating great flavors and then interspersed by charred roasts.
First and foremost, Roast Graphs provide a reliable tree ability in maintaining the consistent quality of roasting. The more detailed a roasting chart, the higher the reliable reference level to allow you to reproduce the time and temperature during each roast.
Not only does the data recording role allow you to maintain consistency, but roasting charts also help us detect specific factors that affect the final taste of coffee, such as temperature attrition, air convection, rate of heat increase, and pressure.
In other words, a roasting chart enables you to determine what adjustments are required to attain the desired flavor and what factors contributed to flavor differences during roasting.
Roast Profile – Temperature Chart During Coffee Roasting
There are many ways to record a roasting graph, but ng is mainly based on the basic principle that the probes (sensors) placed in the roaster will constantly record the data and transfer it to the computer for encryption and writing into charts. Most modern roasters have built-in sensors, and there’s also a lot of roast profile software.
But they all manifest in two primary forms of graphs:
- Control curves: This graph denotes parameters that you can directly impact, such as temperature settings, airspeed, airflow, etc.
- Reading curves: These are indirect parameters that you cannot directly impact such as coffee temperature, air temperature, Rate of rising (ROR), and relative humidity (RH) …
It’s not easy to fully comprehend and apply all of the above criteria. If you display all of these graphs on a computer screen during roasting, you’ll quickly lose sight of the most intriguing aspects of each coffee bean. As a result, we’ll concentrate on some of the fundamental notions that practically every Roaster use as a helpful tool.
Temperatures of the beans and the air
Since most roasters have the same operating principle of using a heat source (gas, oil, or electricity) to heat the air and bring this air into coffee beans’ heating, there is always a temperature difference in the process.
So we have to simultaneously measure the temperature of the air and the mass of particles to be easily controlled.
The temperature difference between air and temperature (or distance between two graph lines) is indicative of the ratio of temperature loss at close intervals between the two curves indicating a significant air convection rate and high heat exchange rate.
Rate of Rising (RoR) – Rate of Increase
But, when the coffee bean is fresh, it can continuously absorb the heat from a very hot roaster, so the temperature of the grain will increase continually / second. Gradually, the temperature difference between the coffee bean and the machine is lower.
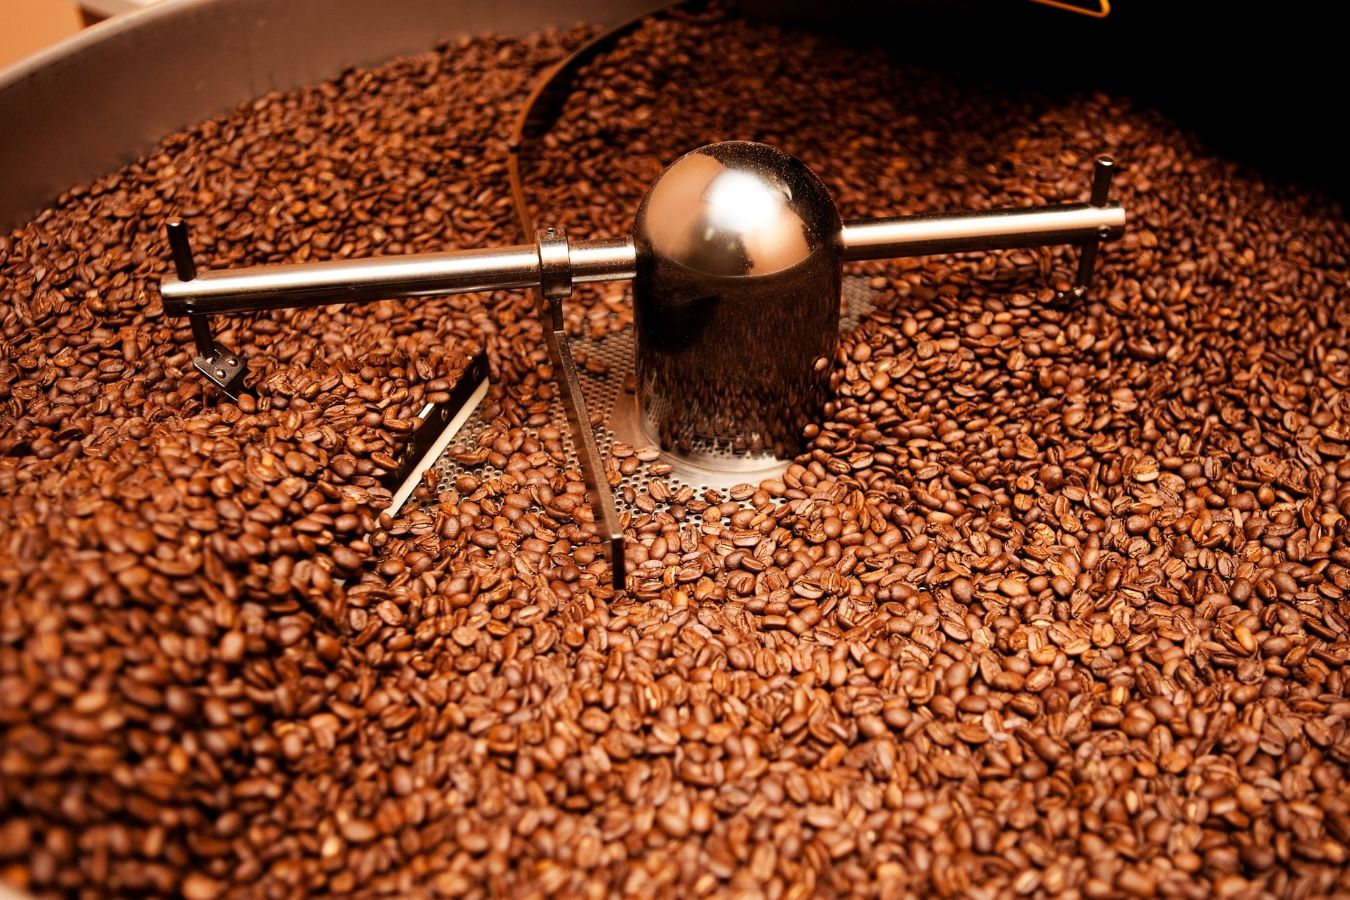
The grain will increase the heat more slowly per second. And Rate of rising (RoR) is a graph that shows the process of improving the temperature of coffee beans during roasting.
You’ll often hear people discuss high or low. And simply put, a higher RoR indicates that your roasting process is progressing faster; a lower value means it’s moving more slowly.
During roasting, the ROR will initially increase at a rapid rate and then taser as the roasted coffee is complete. The goal of the roaster operator is to keep the ROR down.
There are so many topics to address about ROR that this page will not handle the quantity of knowledge that ROR delivers (see also Rate of Rising) (RoR). However, the most common application of ROR is to predict the evolution of coffee flavor during roasting. ROR is used by experienced roasters to “read” chemical changes in coffee beans at precise intervals, usually before, during, and after the initial explosion:
- When has a straight line, the coffee beans begin to enter the first crack 2-3 minutes later.
- Due to significant volumes of dissipated water vapor, ROR tends to drop quickly in head fractures.
- ROR’s popularity tends to skyrocket after this initial surge.
Key Stages On The Temperature Graph
As previously emphasized, with many graphs and parameters during roasting, the temperature graph is the core part, since after all, the whole roasting process is simply heating for the physiological and chemical changes in the grain structure, so at each point on the temperature test, we can know that the coffee beans have developed.
To what extent taste, some temperature milestones that you need to pay attention to such as:
Charge Temperature
Roaster temperature (specifically roasted drums) when not adding coffee.
Turning Point (TP) – heat transfer phase
You can imagine, when the roaster preheats the green coffee at room temperature, the temperature will drop quickly but soon at the time when the temperature starts to rise again is called Turning Point.
First crack
During roasting, coffee beans will release significant moisture, carbohydrate components will be caramelized, and countless other complex reactions will produce CO2.
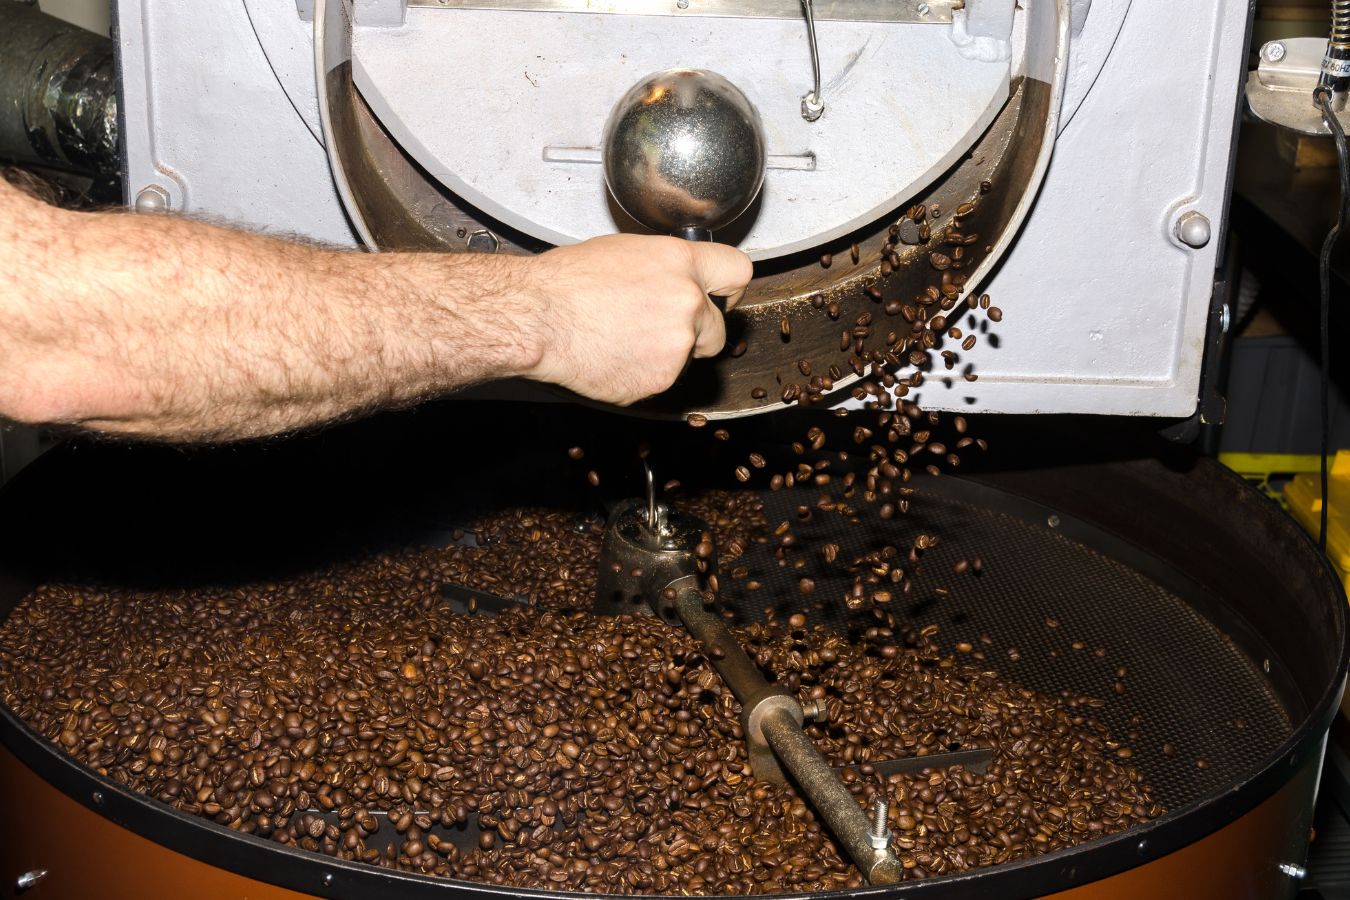
This is the stage — when the coffee reaches a particular temperature, humidity and CO2 are released along the grain’s groove, causing fractures and minor explosions. The first crack or explosion is used to identify the evolution of flavor in each particle.
Development (RD)
Temperature for development: The taste of the coffee will emerge gradually throughout the roasting process, but only for a brief time (from 45 seconds to 1 minute). The tastes alter from acidity to body qualities during the first crack.
The natural acid content of coffee symbolizes coffee’s “fruit” features, with high concentrations of fruit-related aromas generally known as acidity.
In contrast, the body is regarded as the “seed” characteristic, with more prevalent smoke, cocoa, chocolate, and wood odor. Depending on the desired taste, you will extend or shorten the Roast Development stage accordingly.
End Temperature (ET) – End heat
Simply the temperature measured at the end of the roasting process.
A rundown of Roast graphs
After a series of theories – Roast graphs in general and temperature graphs, in particular, are a challenge for coffee lovers because there is a lot of data to collect and learn. However, gradually understanding air temperature, particle temperature, RoR, first crack, and so on.
You will truly understand and be passionate about how the flavors form during roasting. So please don’t get discouraged, but reread it and shake hands with your roasting art.
Reference source:
- www.williamstownroasters.com/ Understanding Coffee Roasting Curves
- www.perfectdailygrind.com/ Coffee Roasting Essentials: A Guide to Rate of Rise (RoR)
- www.perfectdailygrind.com/ Roaster Basics: An Explanation of Roast Graphs
- www.perfectdailygrind.com/ The S-Curve Roast Profile: Exploring Roasting Basics

